Below is just a small sample of plots that were created with #lLabPlot. ( cdn.masto.host )
cross-posted from: https://floss.social/users/LabPlot/statuses/112484470459165421
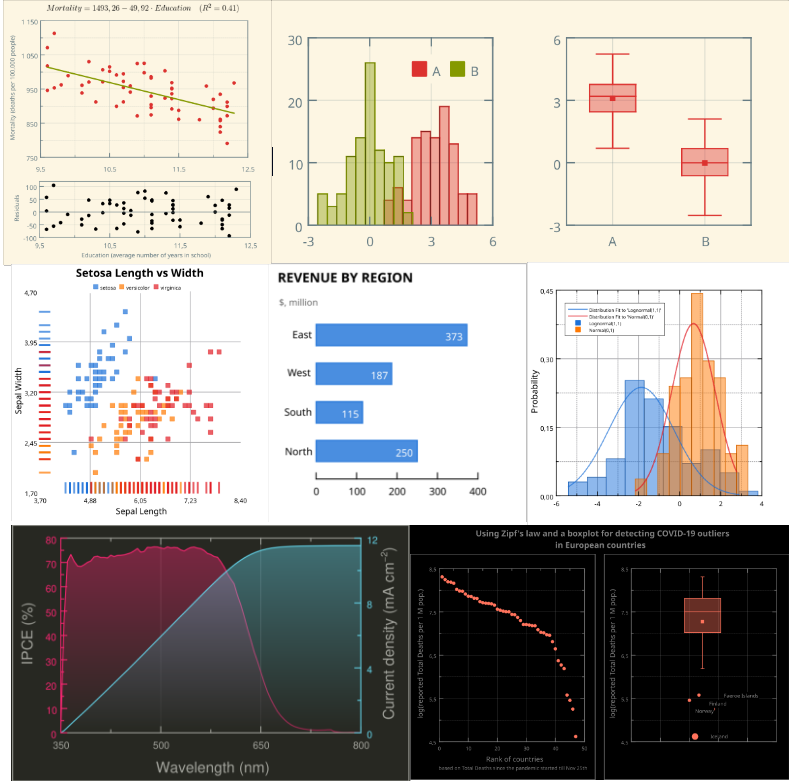
Below is just a small sample of plots that were created with #lLabPlot.
#LabPlot is a FREE, open source and cross-platform Data Visualization and Data Analysis software.
Would you like to share with us your plots made in LabPlot?
#DataAnalysis #DataScience #Data #DataViz #DataVisualization #Science #Statistics #Mathematics #Math #STEM #FOSS #FLOSS #OpenSource #KDE

